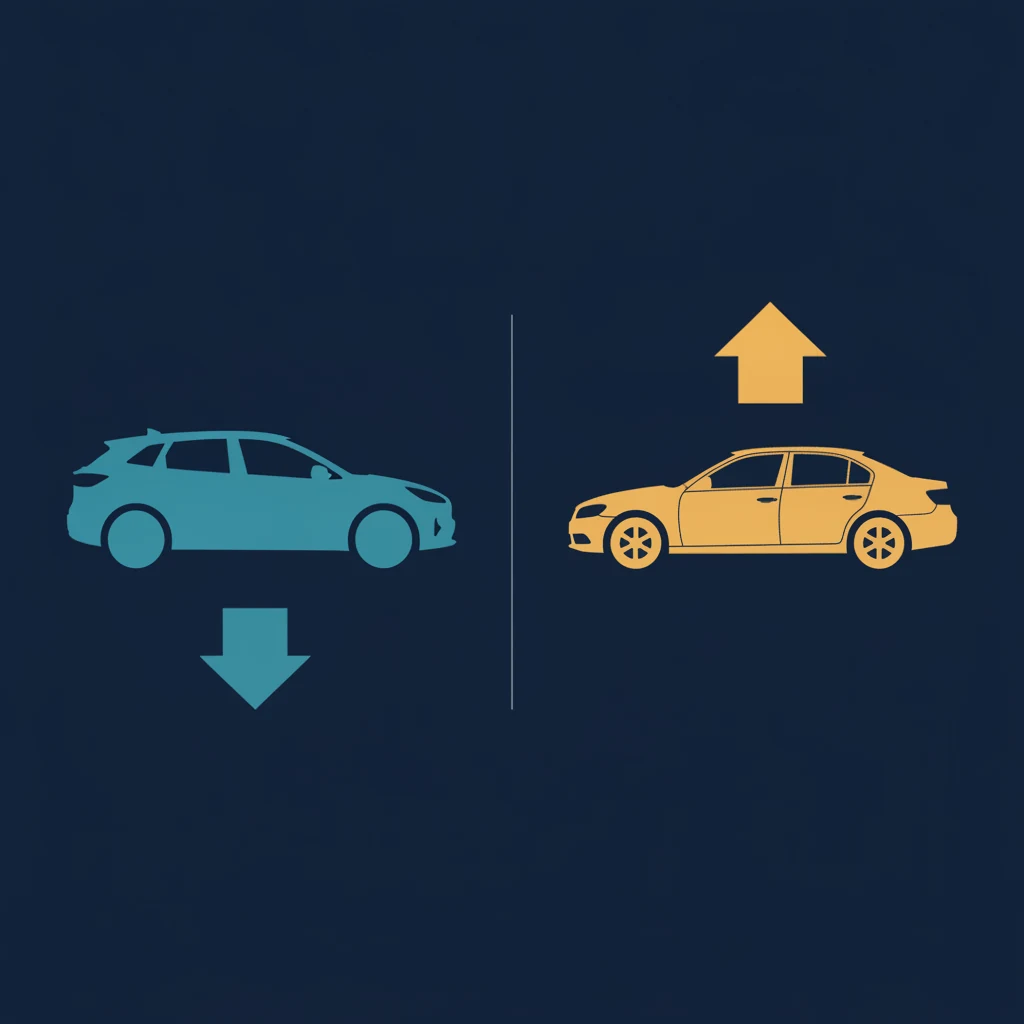
One year ago, a new EV buyer could layer $9,950 in combined incentives on their purchase: $7,500 from the federal Clean Vehicle Tax Credit (30D) plus dealer incentives averaging $11,279 per unit. Today that stack is gone. The federal 30D credit was terminated on September 30, 2025 under the One Big Beautiful Bill Act. And now, according to J.D. Power and GlobalData's September 2026 Automotive Forecast, dealer incentives on EVs have fallen another $2,450 — to $8,829 per unit. Meanwhile, gas and hybrid car dealers are spending more: incentives on those vehicles rose $797 (31.6%) to $3,319 per unit.
That is a $3,247 year-over-year swing against EVs at the dealer level, compounding on top of the credit loss. If you are using a break-even calculation from 2024 or early 2025 to decide whether to buy an EV, those numbers are no longer accurate.
What J.D. Power Found This September
The September 2026 Automotive Forecast, published September 24, 2026, captures a market in transition. EV retail share has fallen sharply: electric vehicles accounted for just 7.9% of retail new-vehicle sales in September 2026, down 6.5 percentage points from 14.4% a year earlier. That decline tracks directly with the incentive reversal.
| Incentive Category | Sept 2025 | Sept 2026 | Change |
|---|---|---|---|
| EV dealer incentives (avg/unit) | $11,279 | $8,829 | −$2,450 (−21.7%) |
| ICE/hybrid dealer incentives (avg/unit) | $2,522 | $3,319 | +$797 (+31.6%) |
| Year-over-year swing against EVs | — | — | −$3,247 |
EVs still receive more dealer incentive dollars than gas cars — $8,829 vs. $3,319 — but the gap is narrowing fast. A year ago the spread was $8,757. Today it is $5,510. That compression means the effective sticker-price advantage EVs held at many dealerships has eroded by roughly $3,200 since last September, with no offsetting federal credit to cushion the difference.
Two Hits in One Year
The math compounds in a way that is easy to underestimate. Most EV cost comparisons published in 2024 assumed the $7,500 30D credit as a baseline. Our own EV vs. gas breakdown without subsidies exists specifically because that assumption was already fragile. Now there are two separate incentive headwinds operating simultaneously.
For a buyer who would have qualified for the full 30D credit on a vehicle like the Tesla Model 3 or Chevrolet Equinox EV: the total incentive environment has deteriorated by roughly $9,950 in twelve months — $7,500 in federal credits plus $2,450 in reduced dealer support. That is not a rounding error. On a five-year cost comparison, a $9,950 upfront swing extends the break-even timeline by 18 to 24 months at typical residential electricity and gas prices, depending on the specific vehicles and how much the buyer charges at home versus on public networks.
The vehicles themselves have not changed. Home electricity rates remain materially cheaper than gasoline on a per-mile basis — the EIA's June 2026 Electric Power Monthly pegs national average residential electricity at $0.1834/kWh, and at that rate, most EVs still travel for 4–6 cents per mile versus 11–14 cents per mile for a comparable gas vehicle. The fuel savings are real. What changed is the upfront math.
How This Affects the Break-Even on Specific Comparisons
The impact varies by vehicle pair. Comparisons where the EV carries a large price premium over its gas counterpart feel the most pressure. In our Tesla Model 3 vs. Toyota Camry analysis, the Model 3 RWD starts roughly $15,000 above the Camry LE. Without the 30D credit and with lower dealer incentives, that gap now stays closer to $15,000 net — meaning the break-even on fuel savings alone stretches toward 8–10 years at average mileage and home-charging rates.
Comparisons where the EV and gas vehicle are closer in price tell a different story. An intra-brand crossover pairing — an EV crossover against a hybrid crossover from the same manufacturer — often sits within $6,000 to $10,000, and the fuel savings can close that gap in 4–6 years even without federal credits. The 30D credit death and reduced dealer incentives hurt most at the high end of the EV price ladder.
The break-even also shifts meaningfully based on charging behavior. A buyer who charges primarily at home on residential rates is working with the favorable 4–6 cents/mile figure. A buyer who relies on public DC fast charging for 40% or more of their miles is paying $0.35–$0.54/kWh on most networks — which erodes or eliminates the per-mile fuel advantage entirely. Our EV vs. gas calculator lets you set your own home/public charging split to get a personalized break-even number.
The One Exception: California's MyFirstEV Program
California buyers have a partial offset that other states do not. The California Air Resources Board runs the MyFirstEV program, which provides an instant point-of-sale rebate — applied directly to the sales contract, not filed after purchase — of up to $3,500 for first-time EV buyers purchasing an eligible new vehicle.
The program expanded in September 2026: Subaru officially joined, adding the Solterra to the eligible vehicle list alongside models from Chevrolet, Ford, Hyundai, Kia, Lucid, and Tesla. Eligibility is income-qualified (roughly below 300% of the federal poverty level for the base tier), and the rebate applies only to California residents buying through participating dealerships.
For a qualifying California buyer, the MyFirstEV rebate recovers $3,500 of the $9,950 in lost incentives — meaningful, but not a full replacement. The state's own California EV incentives page lists the program details alongside utility rebates and DCFC installation credits that can stack on top.
What to Do With This Information
The EV cost case has not reversed. Fuel savings are still real, maintenance costs are still lower, and the vehicles themselves are better than they have ever been. What has changed is the timeline to break even, and the upfront net cost that the break-even calculation starts from.
Three things are worth checking before making a decision based on numbers you read elsewhere:
- Your specific vehicles — the incentive environment varies more by vehicle pair than by "EVs vs. gas cars" in aggregate. A $35,000 EV with a small price gap to its gas equivalent breaks even much sooner than a $55,000 luxury EV.
- Your charging setup — home charging at $0.18/kWh and public charging at $0.50/kWh are economically different vehicles. The calculator separates them.
- Your state — MyFirstEV, utility rebates, and state EV tax credits vary widely. California is not the only state with residual support; check the incentives map for your state's current programs.
Run your own break-even calculation with updated 2026 pricing — no federal credit assumed.
⚡ Open the EV vs. Gas CalculatorThe dealers are adjusting. Gas car incentives rising 31.6% while EV incentives fall 21.7% is a direct response to EV retail share dropping from 14.4% to 7.9% in twelve months. That pressure may reverse as automakers work to rebuild demand — or it may persist if the broader policy environment stays hostile to EV adoption. Either way, the calculation worth doing today is the one based on September 2026 numbers, not 2024 ones.